Forecasting tomorrow's electricity prices in DE-LU and ES — with calibrated uncertainty, so the operators on the other side of the bar chart actually trust the number.
European day-ahead markets aren't broken — but they're stressed. Negative midday prices in Iberia, evening spikes north of €400/MWh in Germany, fuel shocks, congested cross-border flows. Better forecasts are the diagnostic that lets operators, traders and storage assets stabilise the system instead of reacting to it.
Spikes, troughs, negative prices, congestion. Symptoms of a system absorbing renewables faster than it can balance them.
Day-ahead price expectations are the signal every other actor — storage, demand response, generation — conditions on.
Point predictions are easy. Honest 95% intervals are what let an operator commit capital with confidence.
Same model family, separately tuned for DE-LU and ES — two patients, two treatment plans.
DE-LU and ES share an evaluation window and almost nothing else. Different fuel mix, different generation curves, different price regimes — so each gets its own model.
Marginal cost is set by gas turbines on demand peaks. Spreads of €400+/MWh inside a single day are routine.
A textbook duck-curve, deep enough that 2025 saw zero-or-negative prices on most weekday middays.
Four upstream feeds — each driving a different part of the price curve.
Spark spread lags + short-horizon price lags do most of the work — with ENTSO-E D‑1 load & renewable signals providing the broader system picture.
Each model trains independent quantile heads. The simple average is then post-hoc calibrated to a 95% prediction interval.
Optuna · 50 trials per zone, tuned directly on the contest's pinball loss — no proxy objective.
Side note: the loss is asymmetric (q=0.45), so we submit p45 in the p50 column — theoretically optimal under the metric.
Three things that broke — and what we did about them.
At inference, lag_1h is a prediction, not an observation — errors compound.
Public APIs carry ~90 days of futures; we needed two years of TTF, EUA and Brent.
spark_spread = price − gas_cost contains the target at training time — a subtle look-ahead.
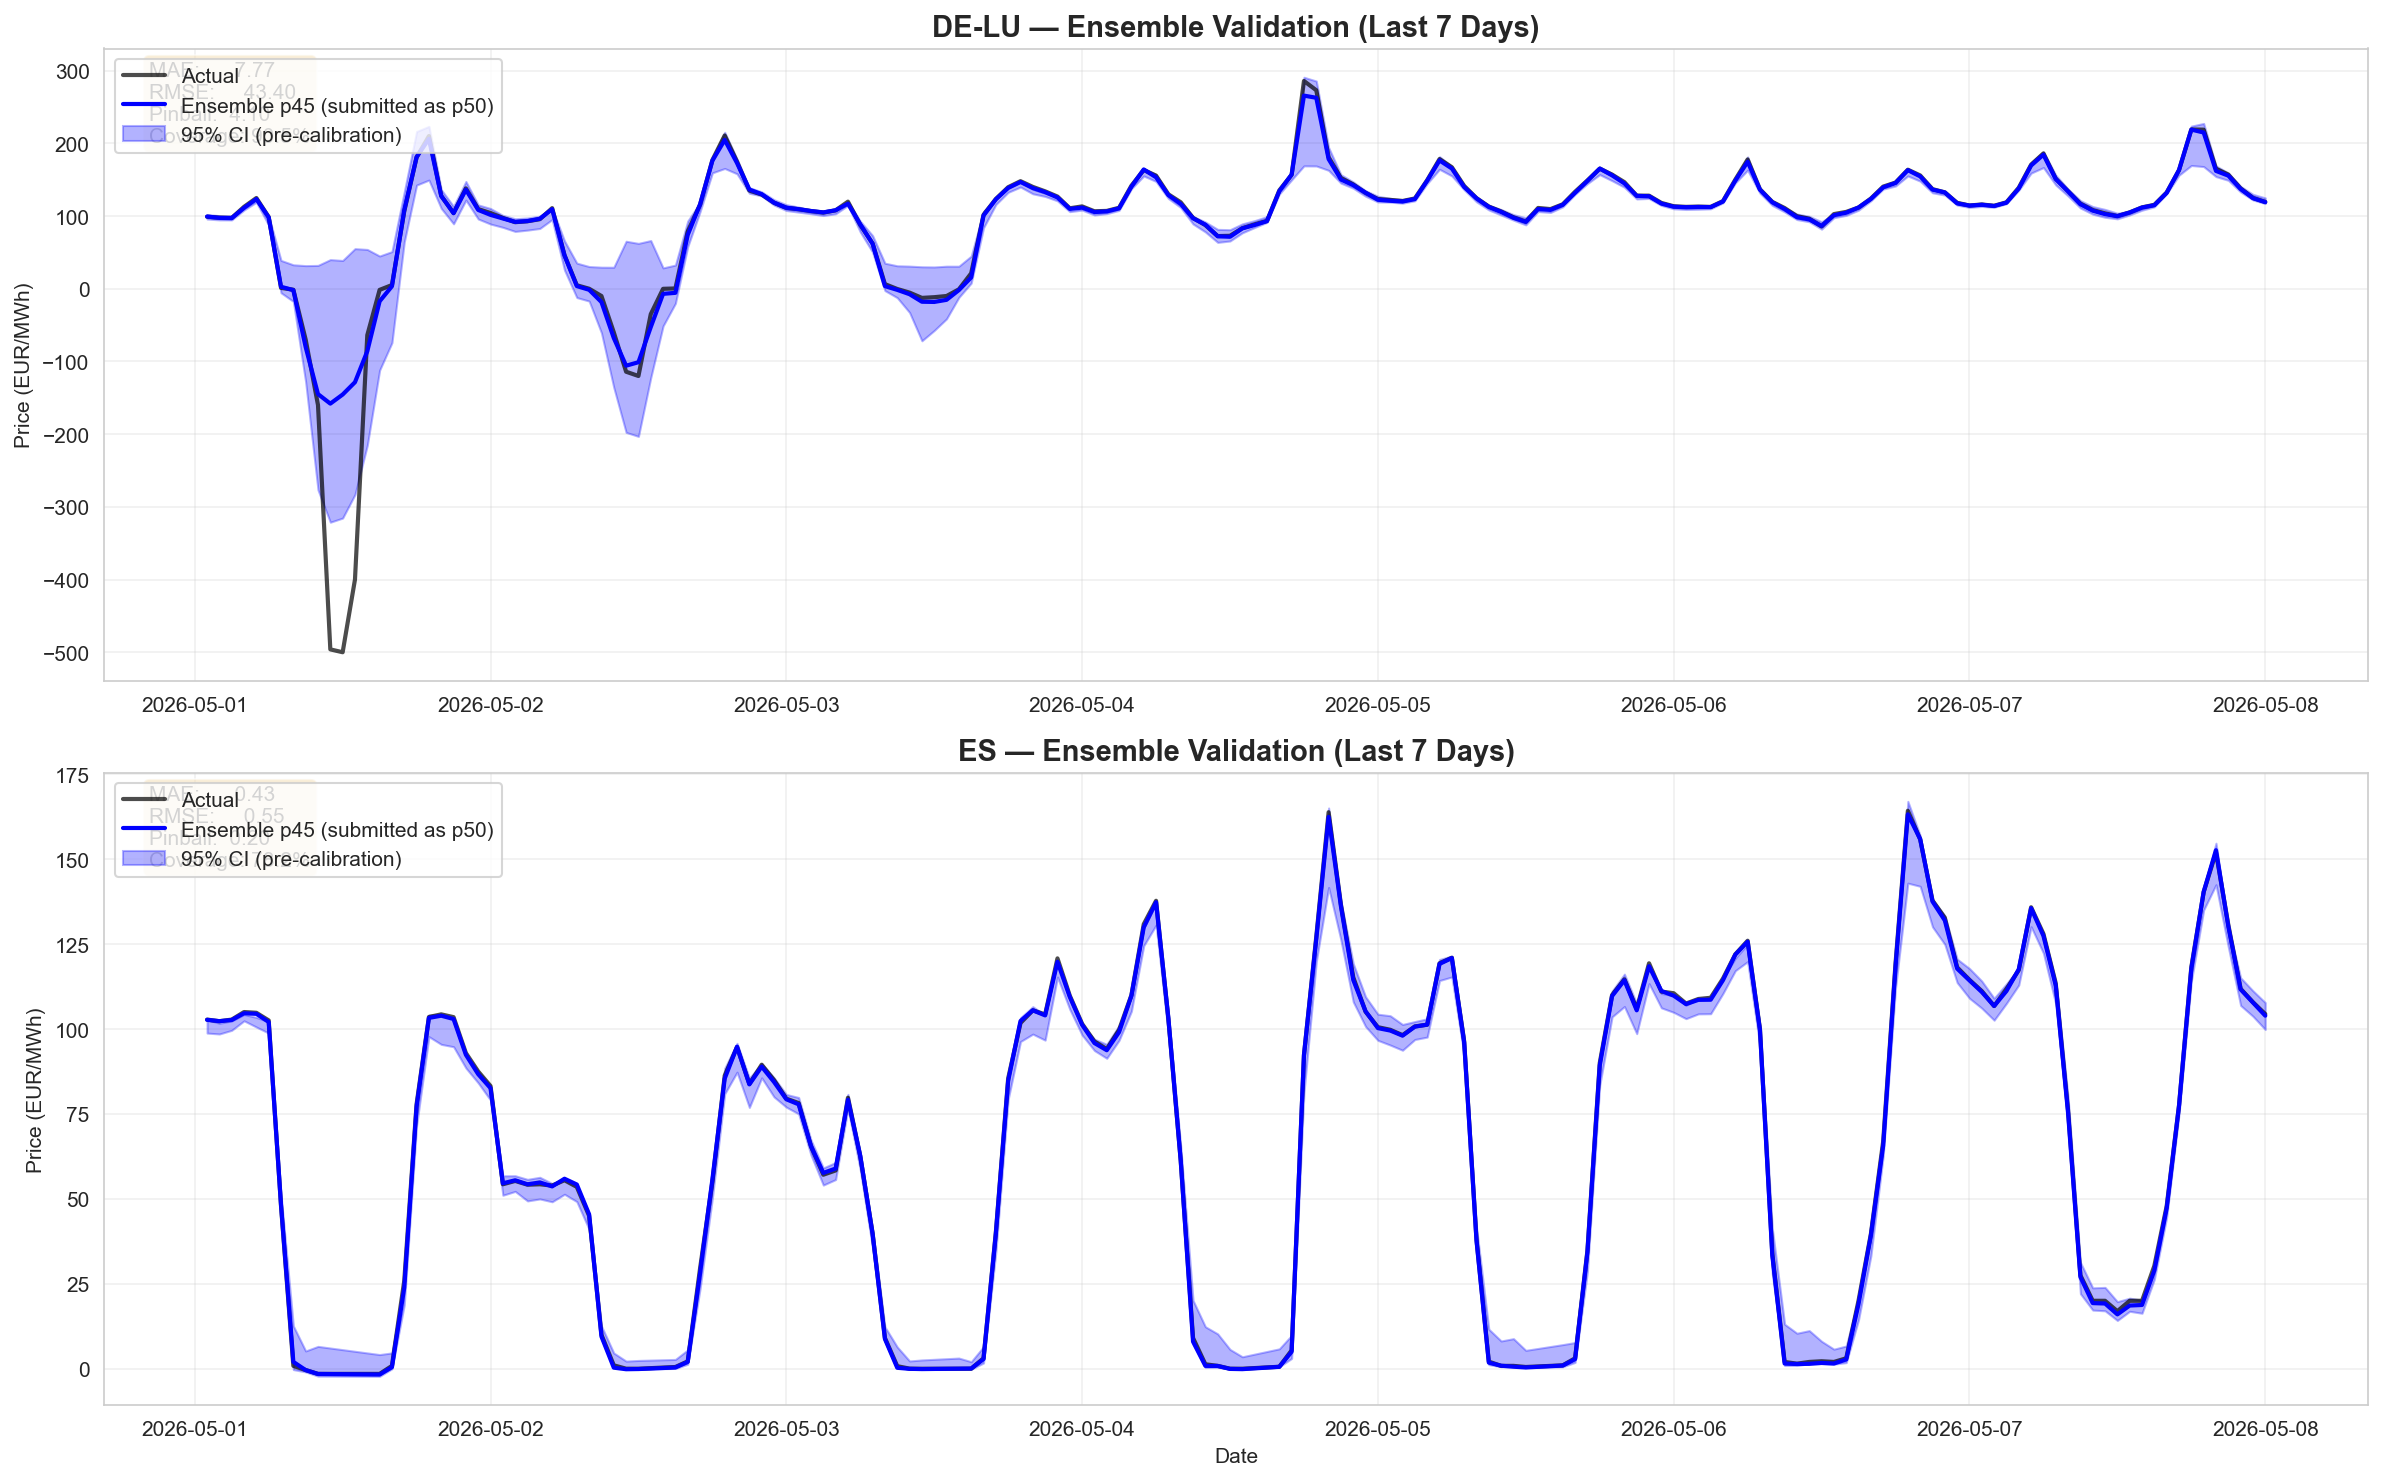
95% interval coverage in both zones — ES is an order of magnitude tighter than DE-LU.